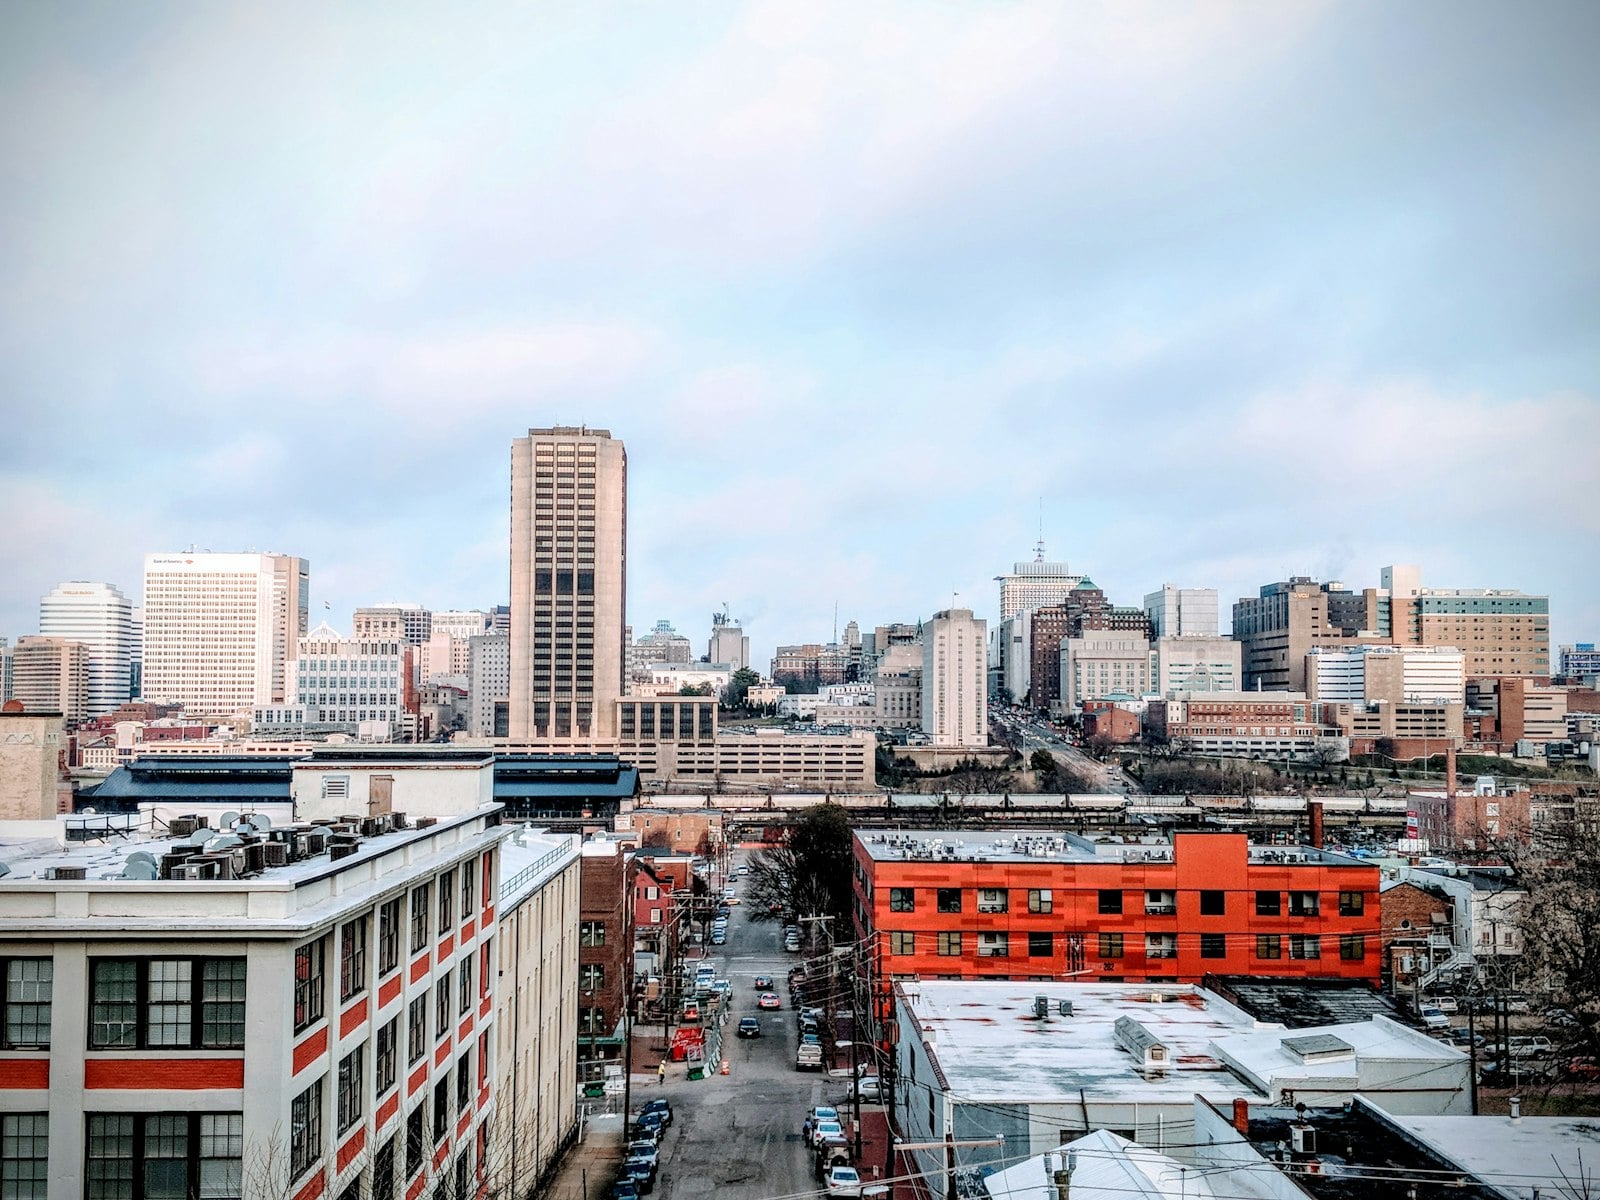
Richmond, Virginia Real Estate Market Report – Week of July 13, 2026: What Buyers & Sellers Must Know
Fresh citywide data on prices, inventory, and days on market across The Fan, Church Hill, Scott’s Addition, Manchester, and every Richmond zip code.
The Richmond, Virginia real estate market in July 2026 is moderately balanced with a slight tilt toward buyers: citywide median sale price sits at $378,500 (up 2.9% YoY), active listings have climbed to 1,340 homes, and the average home spends 26 days on market. Months of supply now stands at 3.1, the highest reading since early 2023, giving buyers more room to negotiate while sellers who price correctly are still closing near list price. Neighborhoods like The Fan, Museum District, and Scott’s Addition remain competitive, while parts of the Northside and Southside offer more breathing room, favoring sellers with updated, move-in-ready homes and buyers willing to act quickly on well-priced listings. Mission Realty Team breaks down the numbers neighborhood by neighborhood below.
Table of Contents
- Richmond Market Snapshot: Inventory & Overall Conditions
- Median Home Prices & Neighborhood Trends Across Richmond
- Days on Market & Pricing Strategy in Richmond’s Current Market
- What Richmond Buyers Should Know Right Now
- What Richmond Sellers Should Know Right Now
- Richmond Neighborhood-by-Neighborhood Outlook
- Frequently Asked Questions
Is Richmond, Virginia a buyer’s or seller’s market in July 2026? The data says it is a balanced market leaning slightly toward buyers, with 3.1 months of supply, a citywide median sale price of $378,500, and homes averaging 26 days on market – a meaningful shift from the frenzied seller’s market Richmond saw in 2021-2022 that gives both sides real leverage depending on price point and neighborhood.
Across the city, 1,340 active listings were on the market as of this week, up from 1,190 a year ago – a 12.6% increase in inventory that has cooled bidding wars outside the hottest urban core pockets. The list-to-sale price ratio citywide is 98.7%, so well-priced homes are still selling close to asking, though routine 10-over-list offers are now largely confined to Scott’s Addition (23230) and parts of the Museum District (23220). Major employers including VCU Health, Capital One, Dominion Energy, Altria, CarMax, and the Commonwealth of Virginia continue to anchor steady buyer demand from relocating professionals and first-time buyers.
This report from Mission Realty Team covers the full Richmond city footprint – The Fan, Museum District, Church Hill, Scott’s Addition, Manchester, Forest Hill, Westover Hills, and Northside – using zip codes 23220, 23221, 23222, 23223, 23224, 23226, and 23230. Read on for a neighborhood-level breakdown of pricing, inventory, and strategy for buyers and sellers alike.
What Does Richmond’s Housing Inventory Look Like This Week?
Richmond citywide active inventory sits at 1,340 homes as of July 13, 2026, a 12.6% increase year-over-year from 1,190 listings in 2025. New listings over the past 30 days totaled 512, with 468 homes going under contract and 431 closing – a market still absorbing supply, but at a slower clip than the pandemic-era peak.
Months of supply now stands at 3.1 citywide. Anything under 4 months is generally still favorable to sellers, but the climb from 2.2 months a year ago signals buyers are regaining negotiating power, especially above $450,000.
Pending sales dipped slightly compared to June, typical of the mid-summer seasonal slowdown, but overall transaction volume remains 4.2% above the five-year July average.
How Much Are Homes Selling For in Richmond’s Neighborhoods?
The citywide median sale price in Richmond is $378,500, up 2.9% year-over-year from $367,800 in July 2025 – healthy growth, but well off the double-digit spikes of 2021, reflecting a market settled into a sustainable pace.
Neighborhood pricing varies widely. The Fan (23220) and Museum District (23220/23221) remain the priciest walkable neighborhoods, with median prices near $512,000 and $498,000 respectively, driven by historic housing stock and proximity to VCU and Carytown. Scott’s Addition (23230) continues its transformation from industrial district to condo and townhome hotspot, with a median price of $421,000 and the fastest YoY appreciation in the city at 6.1%.
On the more affordable end, Church Hill (23223) offers a median price of $342,000 with strong appreciation potential near the historic district, while Manchester (23224) sits at $329,000, still one of the best value plays south of the James River. Forest Hill and Westover Hills (23225) average around $415,000, and Northside (23222) posts a median of $298,000, the most accessible entry point for first-time buyers within city limits.
How Long Are Homes Sitting on the Market in Richmond?
The average Richmond home is spending 26 days on market before going under contract, up from 19 days a year ago – still a brisk pace historically, but the extra week gives buyers more room to schedule inspections, negotiate, and avoid the rushed decisions common in 2021-2022.
Pricing strategy matters more than ever. Homes priced within 2% of recent comparable sales average just 18 days on market and a 99.6% list-to-sale ratio, while homes priced more than 5% above comps often languish 45+ days and settle for 94-96% of original list price after a price reduction.
The citywide list-to-sale ratio of 98.7% tells the real story: Richmond is not a market where sellers can price aggressively and expect multiple offers to bail them out. Correct initial pricing, informed by hyperlocal comps, is the single biggest driver of a fast, full-value sale right now.
What Should Richmond Buyers Know Right Now?
Buyers in July 2026 have more leverage than they’ve had in years, with 3.1 months of supply and rising inventory across nearly every Richmond zip code. This is especially true above $450,000, where inventory growth has outpaced demand and sellers are more willing to negotiate on price, closing costs, and repairs.
Mortgage rates remain a key affordability factor. With rates hovering in the mid-6% range for a 30-year fixed loan, buyers should get fully underwritten pre-approval, not just pre-qualification, before making offers in competitive pockets like Scott’s Addition or The Fan.
First-time buyers should look closely at Northside (23222) and Manchester (23224), where median prices remain well under the citywide figure and inventory is more plentiful. Buyers targeting the Museum District or Church Hill should be ready to move within a week or two of a strong new listing, since desirable, updated homes there still attract multiple offers.
What Should Richmond Sellers Know Right Now?
Sellers can still achieve strong outcomes, but the strategy has shifted from “list high and see what happens” to “price accurately and present impeccably.” With a 98.7% list-to-sale ratio citywide, homes priced right and shown well are closing very close to asking, often within the first three weeks.
Staging and pre-listing prep matter more now than during the seller’s market peak. Homes with professional photography, pre-listing inspections, and minor cosmetic updates average 9 fewer days on market than homes listed as-is, per Mission Realty Team’s internal data from the past 90 days.
Sellers in higher-inventory areas like Forest Hill, Westover Hills, and outer Northside should expect more negotiation on inspection items and closing costs than sellers in tighter submarkets like Scott’s Addition or The Fan. Timing a listing for early in the week, when buyer search traffic peaks, continues to shave days off marketing time.
Neighborhood-by-Neighborhood Outlook: Where Is Richmond’s Market Headed?
The Fan and Museum District (23220, 23221) should remain the most competitive submarkets through the rest of 2026, supported by proximity to VCU, Carytown, and the Boulevard corridor, with days on market staying under 20 in the most walkable blocks.
Scott’s Addition (23230) is likely to keep posting the city’s strongest appreciation as new condo and loft conversions attract young professionals working at Capital One, Dominion Energy, and downtown employers. Church Hill (23223) should see steady, sustainable growth as renovation activity and historic district appeal continue drawing move-up buyers and investors.
Manchester (23224) and Northside (23222) are positioned as Richmond’s best value opportunities for the remainder of 2026, with room for appreciation as buyers priced out of The Fan and Museum District look for alternatives within city limits. Forest Hill and Westover Hills (23225) should hold steady as family-friendly, moderately priced options near the James River Park System.
| Neighborhood / Zip Code | Median Sale Price | Active Listings | Avg. Days on Market | Months of Supply | List-to-Sale Ratio |
|---|---|---|---|---|---|
| Citywide Richmond | $378,500 | 1,340 | 26 | 3.1 | 98.7% |
| The Fan (23220) | $512,000 | 94 | 18 | 2.4 | 99.8% |
| Museum District (23220/23221) | $498,000 | 81 | 19 | 2.6 | 99.5% |
| Scott’s Addition (23230) | $421,000 | 68 | 22 | 2.5 | 99.9% |
| Church Hill (23223) | $342,000 | 132 | 27 | 3.0 | 98.2% |
| Manchester (23224) | $329,000 | 146 | 29 | 3.4 | 97.9% |
| Forest Hill / Westover Hills (23225) | $415,000 | 103 | 25 | 2.9 | 98.6% |
| Northside (23222) | $298,000 | 178 | 32 | 3.5 | 97.6% |
Frequently Asked Questions About the Richmond VA Real Estate Market
Is Richmond, VA a buyer’s or seller’s market right now?
Richmond is currently a balanced market with a slight lean toward buyers. Citywide months of supply is 3.1, up from 2.2 a year ago, and inventory has grown 12.6% year-over-year. Sellers with well-priced, updated homes are still closing near list price, but buyers have more selection and negotiating room than in recent years.
What is the median home price in Richmond, Virginia in 2026?
The citywide median sale price in Richmond is $378,500 as of July 2026, up 2.9% year-over-year from $367,800. Prices vary significantly by neighborhood, ranging from around $298,000 in Northside to over $512,000 in The Fan.
How many days does it take to sell a house in Richmond right now?
Homes in Richmond are averaging 26 days on market before going under contract, up from 19 days a year ago. Homes priced accurately relative to recent comps sell in as few as 18 days, while overpriced listings can linger 45 days or more.
Which Richmond neighborhood has the most affordable homes?
Northside (23222) currently offers the most affordable entry point into Richmond’s housing market, with a median sale price of $298,000. Manchester (23224) is a close second at $329,000, and both areas carry more inventory and slightly longer days on market than pricier neighborhoods.
Which Richmond neighborhood is appreciating the fastest?
Scott’s Addition (23230) is posting the strongest year-over-year appreciation in the city at 6.1%. Continued condo and loft development, along with proximity to downtown employers, is driving sustained demand. Church Hill (23223) is close behind at 5.4% YoY.
Are home prices dropping in Richmond, VA?
No, home prices are still rising citywide, just at a slower and more sustainable pace than in 2021-2022. The 2.9% year-over-year increase reflects normal seasonal appreciation rather than a downturn. Some individual overpriced listings are seeing price reductions, but that reflects pricing strategy rather than a broad decline.
What is months of supply and why does it matter in Richmond?
Months of supply measures how long current inventory would last at the present sales pace, and it’s the clearest signal of market balance. Richmond’s 3.1 months of supply this week is up from 2.2 a year ago, indicating a shift toward more buyer leverage. Generally, under 3 months favors sellers, 3 to 5 months is balanced, and above 5 months favors buyers.
Is now a good time to buy a house in Richmond, Virginia?
Yes, for many buyers July 2026 offers better conditions than the past several years, thanks to rising inventory and more negotiating room. Buyers above $450,000 especially benefit from an 18% year-over-year increase in available listings. That said, desirable neighborhoods like The Fan and Scott’s Addition remain competitive, so buyers should still be ready to act quickly on well-priced homes.
What is the list-to-sale price ratio in Richmond and what does it tell buyers and sellers?
Richmond’s citywide list-to-sale ratio is currently 98.7%, meaning homes are selling for just under 1.3% below original asking price on average. This tells sellers that realistic pricing is rewarded with near-full value, while it tells buyers that lowball offers well below asking are unlikely to succeed. Scott’s Addition is seeing ratios closer to 99.9%, reflecting tighter competition.
What zip codes make up the core Richmond city market?
Core Richmond city zip codes include 23220 (The Fan/Museum District), 23221 (Museum District/Near West End), 23222 (Northside), 23223 (Church Hill), 23224 (Manchester/Southside), 23226 (Near West End), and 23230 (Scott’s Addition). Each has distinct pricing and days-on-market trends, which is why Mission Realty Team analyzes hyperlocal data rather than citywide averages.
How do Richmond’s major employers affect the housing market?
Major employers like VCU Health, Capital One, Dominion Energy, Altria, CarMax, and the Commonwealth of Virginia create steady, diversified buyer demand across price points. VCU Health and state jobs drive demand in urban core neighborhoods like The Fan and Church Hill, while Capital One and Dominion Energy employees often look at Scott’s Addition and Northside. This diversity helps insulate Richmond from sharp boom-bust cycles.
Should I wait for interest rates to drop before buying in Richmond?
Waiting carries real tradeoffs, since rising inventory is already giving buyers leverage today. If rates fall meaningfully, expect more buyer competition and potentially higher prices to offset payment savings. Mission Realty Team recommends focusing on what you can control now rather than timing rate movements.
How can I get a hyperlocal market update for my specific Richmond neighborhood?
The most reliable way is a customized comparative market analysis from a local agent who tracks zip-code-level data rather than citywide averages. Mission Realty Team provides free, no-obligation neighborhood reports covering recent comps, competition, and pricing strategy for any Richmond zip code.
Get Your Free Richmond Home Value Report
Whether you’re buying in Church Hill, selling in Scott’s Addition, or just tracking the Richmond market from the sidelines, Mission Realty Team is here to help you make sense of the numbers. Contact Mission Realty Team today for a free, personalized home valuation and neighborhood-specific market analysis.